Introduction
I’m going to start with one of the most common ways GIS data are created. Let’s say you already have a map – either the actual physical paper map, or a PDF or other digital image – and you want to recreate some information – roads, property lines, unstable areas, etc. You could, of course, stare at your map and try to re-draw the feature(s) free-hand, but the easier and better way is to bring the map into GIS and trace over the top of it. This process is referred to as Georeferencing (giving your map image real-world coordinates, locating it in space) and screen digitizing (creating new spatial data on-screen, as opposed to some other methods using specialized equipment, which used to be fairly common, but are rarely seen any more).
If you are working from a paper map, the first step will be to scan it and save it as an image file – what type doesn’t really matter. You won’t be doing much with it, other than using it for reference. In a pinch, if you don’t have access to a scanner, you could even take a photo – but there will be additional distortion, and as a result, the accuracy of the final product will suffer.
The next step is to choose a layer to use as a reference. This needs to be some type of data which already has coordinates, and which shows some features which are also visible on the non-referenced source map. USGS 7.5-minute topo quads are a good choice for many situations, and are available from USGS EarthExplorer. In the directions and screenshots that follow, I georeferenced a map from a THP I wrote to the Big Basin Quad, and digitized road features from it.
Georeferencing
1. Start QuantumGIS. Click the ‘Add Raster Layer’ button. The “Open a 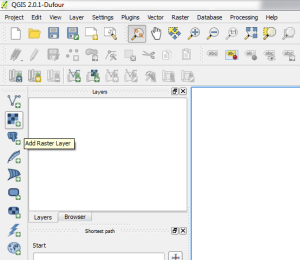 GDAL supported Raster Data Source” dialog box appears. Navigate to where your reference data is saved (again, I am using the USGS Big Basin 7.5 minute quad); select the appropriate data type from the list next to the “File name”, or select “All Files”, and click “Open”. (If know what type of file you are looking for, limiting your search by selecting the appropriate type from the list can make it easier to find the right layer. If you don’t remember, navigate to the folder using your operating system and check.)
2. If you know what coordinate system and datum your reference data use, skip to step 3 – otherwise, you will need to check and make a note of it – you need to use the same coordinate system for your new georeferenced layer. You can check this either by right-clicking (ctrl+click for Mac users) on the layer name in the “Layers” box, or selecting it (Left single-click) and selecting “Layer: Properties” from the menu (“Properties” is about 3/4 of the way down the “Layer” menu). The “Properties” window has 5 tabs or pages: General, Style, Transparency, Pyramids, Histogram, and Metadata. On the “General” tab/page, make a note of the “Coordinate Reference System”. As an aside, if you wish, you can rename this layer by changing the text in the “Layer name” box.
3. Zoom (select the magnifying glass tool, or ‘View: Zoom In’ from the menu) and pan (select the hand-shaped tool or ‘View: Pan Map’) to the approximate area represented by the map you’ll be copying from.
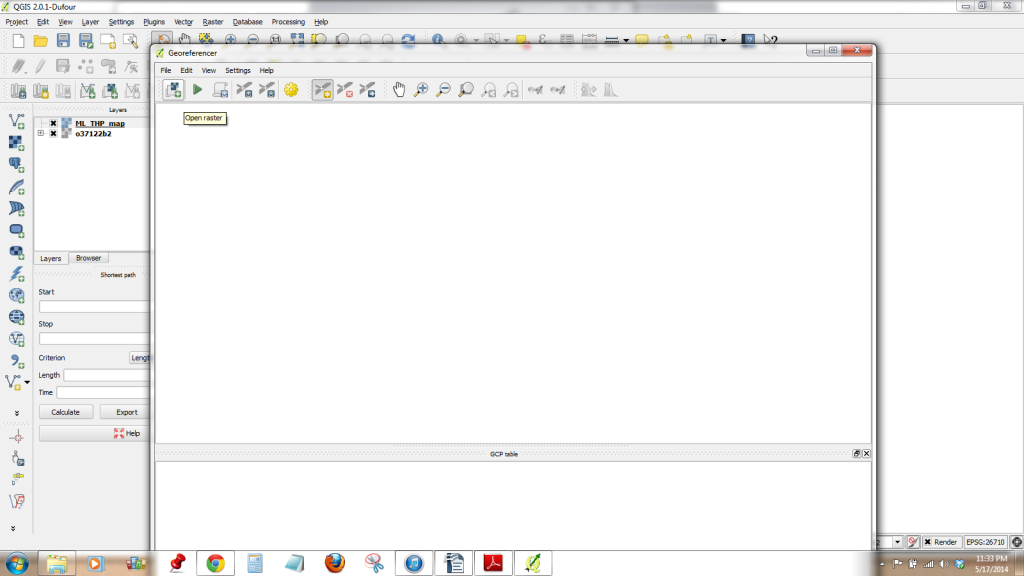
4. From the menu, select ‘Raster: Georeferencer: Georeferencer’. The Georeferencer window should open. Click the ‘Open Raster’ button, and find your un-referenced source map.
Because your data has not been georeferenced, you need to choose a coordinate system for it, and so the “Coordinate Reference System Selector” dialogue box should appear.
Set the coordinate reference system to be the same as your reference layer – the system you made note of in step 2. You can search for the system by entering part of the name in the “Filter” text box – QGIS will automatically filter the systems displayed based on what you type. When you see the system you want to use, select it, make sure it shows up in the “Selected CRS” text box near the bottom of the window, and click “OK”. Your un-referenced map will be added to QGIS, but will not be visible yet – although you have chosen a coordinate system, you haven’t told the software what the actual coordinates are, yet.
5. Your source map should now appear in the Georeferencer window, and the ‘Add Point’ tool should automatically be selected, as shown – if not, select it now. You will now create a series of matched points on your un-referenced source map and on your referenced layer, which you added to QGIS in step 1. For each point, click first on your source map in the Georeferencer window. The ‘Enter Map Coordinates’ dialogue box should appear. At this  point, if you know the coordinates of this point, you can enter them; otherwise, click the ‘From Map Canvas’ button – the Georeferencer window should minimize itself so that you can click on the corresponding point on the layer in the main QGIS window. Once you do, the Georeferencer window should reappear, Click ‘OK’.
6. Make sure you create at least 4 sets of points to tie together – more will be necessary if the map you are working from is especially distorted. When you think you have enough, select ‘Settings: Transformation Settings’ from the menu. There are several options for how to scale, rotate, and stretch your map to fit the points you have just selected. If scaling, rotating, and translating are all that is needed, you can use ‘Linear’ for transformation type, and ‘Nearest Neighbor’ for resampling method. If there are more severe distortions in your source map,using ‘Polynomial 2’ for transformation type should handle them better – ‘Nearest Neighbor’ is likely still appropriate for resampling method, although you may wish to try ‘Cubic’ to see if the results look better. You can always create multiple versions using the same control points and different transformation settings. You need to name your output – it will be saved as a new, georeferenced raster. Click the button to the right of the ‘Output Raster:’ box to navigate to the folder where you want to save it, and choose a name, then click ‘Save’ and ‘OK’.
7. In the georeferencer window, click the ‘Start Georeferencing’ button. Your new georeferenced raster will be created and added to the main QGIS window. I suggest making sure you are happy with it before closing the georeferencer window, in case you need to adjust the location of one or more control points, add new ones, or try different settings. When you do close the georeferencer window, you will be asked if you want to save the points – if you are happy with the results, you don’t need to save the points. You may find it is easier to check the location of your newly-georeferenced source map if you adjust its  transparency. You can do so either by right-clicking (ctrl+click for Mac users) on the layer name in the “Layers” box, or selecting it (Left single-click) and selecting “Layer: Properties” from the menu (“Properties” is about 3/4 of the way down the “Layer” menu). The “Properties” window has 5 tabs or pages: General, Style, Transparency, Pyramids, Histogram, and Metadata. Select the “Transparency” tab/page, move the “Global Transparency” slider, and click “Apply” to adjust the transparency or “OK” to adjust transparency and close the “Properties” window.
Screen Digitizing
Now that you have your source map properly georeferenced, you can create and edit a new vector layer to represent whatever features you would like to copy from it. For my example, I digitized road features mapped on the original THP map to a new vector layer.
1. From the menu, select “Layer: New: New Shapefile Layer”, or use the keyboard shortcut ctrl+shift+n. The “New Vector Layer” window should open. Choose “Point”, “Line”, or “Polygon” from the radio buttons at the top of the window. The QGIS documentation has a pretty good explanation of the differences, if you are unsure which type you should use. The text box between “Type” and “New Attribute” displays the coordinate reference system that will be used for your new layer. If the default is not the system you would like to use, click “Specify CRS” to select the system you would like to use. This does not need to be the same as the system you used for your map. If you are working in California, and you don’t have any preference, NAD 83/State Plane Coordinates is a good choice.
The next two sections deal with the attributes of your new layer. By default, your layer will have the attribute “id”. You don’t need to keep this attribute, but you do need to have at least one attribute to create the layer. Almost all data will eventually have some other attributes – for example: name, length, area, percent slope, condition… any information tied to a physical location, which you would like to track in GIS. Some of these examples can only be calculated after the data has been created – physical parameters such as length and area are a good example. Others, such as name, you may know ahead of time – and you can create those attributes now, and enter them as you go (this is a good idea – it’s generally easier to keep track of names if you enter them as you create the data). To add an attribute, enter a name in the “Name” text box, select the type of data that will be entered from the “Type” drop-down menu, and click “add to attributes list”. All attributes have a width (in characters), which you can edit – the default is 80 for text, which is probably more than you need. If you are entering decimal numbers, you can also specify a precision – the number of places allowed after the decimal. You can always add attributes later. Once you have added any attributes you would like, click “OK” to create your layer.
2. The “New Vector Layer” window should close, and the “Save As” window should open. Navigate to the folder in which you would like to save your new layer, enter a name for it, and click “Save” or press return/enter. Your new layer will be created and added to the main QGIS window.
3. To start editing your layer, either right click (ctrl-click for Mac users) 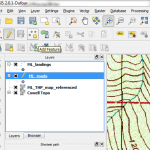 and select “Toggle Editing”, or select the layer, and then choose “Layer: Toggle Editing” from the menu, or click the “Toggle Editing” button (pencil). Click the “Add Feature” tool (2 to the right of the “Toggle Editing” tool) to begin creating features.
4. You can now click on your map to create new features in your layer. As you finish features, the “Attributes” window will open, prompting you to enter values for the attributes you created, or at least the default “id” attribute. Enter a value for any attributes you would like, and click “OK” to create the feature. If you are editing a point layer, you will be prompted to enter attributes for each point. If you are editing a line or polygon feature, since these have multiple points per feature, you need to right-click (ctrl-click for Mac users) to signify the end of a single feature (and prompt the “attributes” window to open). When you are done editing, toggle editing for the layer, using the toggle editing button, or by right-clicking on the layer or selecting “Layer: Toggle Editing” from the menu. The “Stop Editing” window will open – click “save edits” to keep your changes (unless you have made a huge mistake and want to start over). If you are creating large features, it’s a good idea to periodically save your edits, which you can do using the “Current Edits” tool, to the left of the “Toggle Editing” tool.
Mistakes
There are two more editing tools you should be familiar with. The “Node” tool (sixth from left in the line of editing tools) allows you to move or delete individual points, and add new points to features that have already been created (by selecting them, and double-clicking between two points). The “Move Features” tool can be used to select and move an entire feature, preserving its internal geometry.
Layer Symbology/Style
To change how your layer is displayed, right-click (ctrl-click for Mac users) and select “Properties”, or select it and choose “Layer: Properties” from the menu. Select the “Style” tab/page. You can choose from the presets shown, or create your own custom symbology (mostly useful for lines) by clicking “Symbol: Style Manager”. In the “Style Manager” window, select the “Line” tab, and click the “Add Item” button near the bottom of the window (plus symbol). In the “Symbol Layers” box at left, you can add multiple lines (again, using the plus symbol), and for each line you can set color, weight, dashes, etc. When you are done, click “OK”, enter a name for your new symbol, and click “OK” again. You can always edit symbols once they have been created.