Introduction
Generating a list of properties within 300′ of your parcel(s) is a very simple task, using a single data set, which illustrates the utility of the “Buffer” tool. The only thing you need is a vector layer of your county’s assessor’s parcels. Most counties in California make these available in some form online – you can usually google “GIS (county name)” to find their site. Due to state law, counties do not include ownership information with these layers, so you will still be in for a trip to the assessor’s office to fetch the names and addresses, but it’s a lot easier to be certain you’re getting it right when you do the measuring in GIS and not on several paper maps of varying scale, which is what most counties provide if you show up in person. This is especially true for large and odd-shaped properties. For my example, I used the County of Santa Cruz’s data, which is available at http://gis.co.santa-cruz.ca.us/file_download_site/. Santa Cruz makes their data available as a series of geodatabases, which are a good way to transfer data using the internet without losing anything (actually, zipped folders containing geodatabases). Basically, a geodatabase is a way of storing several related layers in a single file. In this case, I’m using the “Cadastral” geodatabase, which includes an index of map books, township/range/sections, tax code areas, assessor’s parcels, and recorded maps. Geodatabases get added to Quantum in a slightly different way than a single vector layer does – I will cover both, although I expect that most counties use a similar strategy for making their data available online. The instructions below assume you have already found and downloaded a layer (or geodatabase containing a layer) representing parcel data for your county – do that now, if you haven’t already.
1. Start QuantumGIS. Click the “Add Vector Layer” button, select 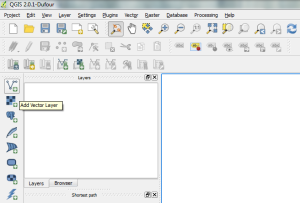
“Layer: Add Vector Layer” from the menu, or press ctrl+shift+v. The “Add Vector Layer” window should open.
A. If your data is a single layer, under “Source Type”, make sure 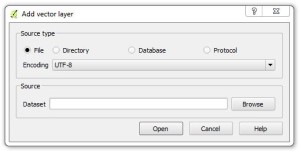 that the radio button for “File” is selected, and click the “Browse” button. The “Open an OGR Supported Vector Layer” window should open. Select “ESRI Shapefiles” from the drop-down menu next to the “File Name” box. Navigate to the folder where your layer is stored, select it, and click the “Open” button twice (once in each window).
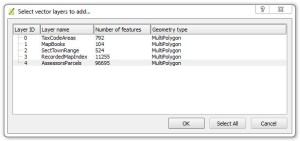
B. If your data is in a geodatabase, under “Source Type”, make sure that the radio button for “Directory” is 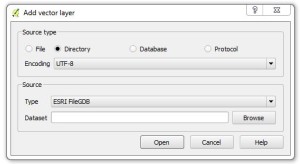 selected, and that “Type” is set to “ESRI FileGDB” (should be by default), and click the “Browse” button. The “Open an OGR Supported Vector Layer” window should open. Select “ESRI Shapefiles” from the drop-down menu next to the “File Name” box. Navigate to the folder where your layer is stored, select it, and click the “Open” button twice (once in each window). The “Select vector layers to add…” window should open. Click on the layer you want, and then click “OK”.
2. The layer will be added to the main QGIS window. Using the “Zoom” tool (shown selected), draw a box around your parcels to zoom to them.

Alternatively, you can right-click on the layer name in the “Layers” pane and select “Open Attribute Table”, or select the layer in the “Layer” pane, and select “Layer: Open Attribute Table” from the menu or click the “Open Attribute Table” button, to open the attribute table for the layer, and find the APN of one of your parcels. Click on the grey first column to select a single feature (parcel), and click on the “Zoom map to the selected rows” button (magnifying glass). The view in the main window will zoom to the parcel you have selected; you can close the attribute table at this point, or click the “unselect all” button (fifth from left) first.

For the sake of simplicity and thoroughness, I’m going to assume that you do not already have a layer for your THP boundary, and that you want to search for all properties within 300′ of your parcel(s) instead. Of course, if you do have a layer for your THP already, you can skip to step 4, and substitute your THP boundary layer for the layer I’m going to create in step 3.
3. Select the “Select Single Feature” tool (shown below) and click on your parcel(s) to select them. Holding down the control key while clicking will allow you to select multiple parcels. You can also use the drop down menu next to the tool button to select features by drawing a rectangle, polygon, or freehand shape, but unless you have a lot of parcels to select, none of those options are likely to be useful. Your parcels will change color when selected, as shown. If you make a mistake in selecting, you can click the “Deselect Features From All Layers” button, just right of the “Select Single Feature” button.

Once you have selected your parcels, either right-click on the layer name in the “Layers” pane and click “Save Selection as” (ctrl-click for mac), or select “Layer: Save Selection as Vector File” from the menu. The “Save Vector Layer as” window should open. “Format” should be set to “ESRI shapefile”, which is a good choice, and “CRS” (coordinate reference system) should be set to the system of the data you downloaded.
{If you want to use a different CRS, you can click “Browse” to open the “Coordinate System Selector” window, and search for the system by entering part of the name in the “Filter” text box – QGIS will automatically filter the systems displayed based on what you type. When you see the system you want to use, select it, make sure it shows up in the “Selected CRS” text box near the bottom of the window, and click “OK”.}
Whichever coordinate system you choose, make a note of it – it’s important in the next step. Click the “Browse” button to open the “Save layer as” window, and navigate to the folder where you would like to save a new layer with only your parcels (a good place to start for your THP boundary). Enter a name for your layer in the “File name” box and click “Save” and “OK”. Your layer will be created, but won’t be added automatically – Click the “Add Vector Layer” button, select “Layer: Add Vector Layer” from the menu, or press ctrl+shift+v to open the “Add Vector Layer” window; make sure the “File” radio button is selected, and click “Browse” to navigate to where you saved your layer, select it, and click “Open” twice (once in each window).
4. First, to clear your selection, click the “Deselect features from all layers” button.

Now select “Vector: Geoprocessing Tools: Buffer(s)” from the menu. The “Buffer(s)” window should open. Use the drop-down menu to set “Input Vector Layer” to the layer you created in step 3 (or your THP boundary layer, if you have loaded one instead). Enter the buffer distance (in the units of the coordinate reference system for this layer – did you make a note?) in the text field next to the “Buffer Distance” radio button, which should automatically be selected. (Assuming you are doing this for notification purposes, and your layer’s CRS is in feet, enter “300”.) Click “Browse” to open the “Save output shapefile” window and again, navigate to the location where you would like to save the new layer representing a buffer on your parcels of the size you have chosen, and click “Save” and “OK”.
Once your layer has been created, the “Geoprocessing” window will open, tell you that your file has been created, and ask if you want to add it to the TOC (table of contents, the “Layers” pane in the main QGIS window). Click “Yes” in this window and “Close” in the “Buffer(s)” window.
You may have noticed the checkbox for “Use only selected features” in the “Buffer(s)” window, and correctly realized that you could have skipped step 3 and buffered your selected parcels directly from the original parcel layer. There is no reason not to do this, but as I mentioned, the parcel boundaries are a good place to start for a THP boundary layer, so I assume most people will want to do the extra step to have this layer.
5. Select “Vector: Spatial Query: Spatial Query” from the menu. The “Spatial Query” window should open. Using the drop-down menu under “Select source features from”, select the parcel layer for your county. Using the drop-down menu under “Where the feature”, select “Intersects”. Using the drop-down menu under “Reference features of”, select the buffered layer you just created, and click “Apply”. Once the tool is done processing, the window will expand to include a list of selected features, which will also be shown in the main window. Close the “Spatial Query” window.
6. Right-click on the parcels layer name in the “Layers” pane and select “Open Attribute Table”, or select the layer in the “Layer” pane, and select “Layer: Open Attribute Table” from the menu or click the “Open Attribute Table” button, to open the attribute table for the parcels layer. In the bottom left, click on the “Show All Features” button, and click “Show Selected Features”. Only parcels within the buffer distance of your parcel should now be shown. Click the “Copy selected rows to clipboard” button. You should then be able to open any spreadsheet program (I use OpenOffice) and paste the records into a new spreadsheet.